Welcome to Siva's Blog

~-Scribbles by Sivananda Hanumanthu
My experiences and learnings on Technology, Leadership, Domains, Life and on various topics as a reference!
What you can expect here, it could be something on Java, J2EE, Databases, or altogether on a newer Programming language, Software Engineering Best Practices, Software Architecture, SOA, REST, Web Services, Micro Services, APIs, Technical Architecture, Design, Programming, Cloud, Application Security, Artificial Intelligence, Machine Learning, Big data and Analytics, Integrations, Middleware, Continuous Delivery, DevOps, Cyber Security, Application Security, QA/QE, Automations, Emerging Technologies, B2B, B2C, ERP, SCM, PLM, FinTech, IoT, RegTech or any other domain, Tips & Traps, News, Books, Life experiences, Notes, latest trends and many more...
Showing posts with label DevOps. Show all posts

Saturday, December 4, 2021

DevSecOps - Reference Architecture and Recommendations

DevSecOps - Reference Architecture and Recommendations

What is DevSecOps?

DevSecOps is the philosophy of integrating security practices within the DevOps pipeline, ensuring two seemingly opposed goals: speed of delivery and secure code. Critical security issues are dealt with as they become apparent at almost all stages of the SDLC process, not just after a threat or compromise has occurred. It’s not only about additional tools that automate tasks, but also about the mentality of your developers.

Recommendations for a comprehensive DevSecOps?

  1. IDE Plugins — IDE extensions that can work like spellcheck and help to avoid basic mistakes at the earliest stage of coding (IDE is a place/program where devs write their code for those who don’t know). The most popular ones are probably DevSkim, JFrog Eclipse, and Snyk.
  2. Pre-Commit Hooks — Tools from this category prevent you from committing sensitive information like credentials into your code management platform. There are some open-source options available, like git-hound, git-secrets, and repo-supervisor.
  3. Secrets Management Tools allow you to control which service has access to what password specifically. Big players like AWS, Microsoft, and Google have their solutions in this space, but you should use cloud-provider-agnostic ones if you have multi-cloud or hybrid-cloud in place.
  4. Static Application Security Testing (SAST) is about checking source-code (when the app is not running). There are many free & commercial tools in the space (see here), as the category is over a decade old. Unfortunately, they often result in a lot of false positives, and can’t be applied to all coding languages. What’s worse is that they take hours (or even days) to run, so the best practice is to do incremental code tests during the weekdays and scan the whole code during the weekend.
  5. Source Composition Analysis (SCA) tools are straightforward — they look at libraries that you use in your project and flag the ones with known vulnerabilities. There are dozens of them on the market, and they are sometimes offered as a feature of different products — e.g. GitHub.
  6. Dynamic Application Security Testing (DAST) is the next one in the security chain, and the first one testing running applications (not the source code as SAST — you can read about other differences here). It provides less false positives than SAST but is similarly time-consuming.
  7. Interactive Application Security Testing (IAST) combines SAST and DAST elements by placing an agent inside the application and performing real-time analysis anywhere in the development process. As a result, the test covers both the source code and all the other external elements like libraries and APIs (this wasn’t possible with SAST or DAST, so the outcomes are more accurate). However, this kind of testing can have an adverse impact on the performance of the app.
  8. Secure infrastructure as code — As containers are gaining popularity, they become an object of interest for malware producers. Therefore you need to scan Docker images that you download from public repositories, and tools like Clair will highlight any potential vulnerabilities.
  9. Compliance as code tools will turn your compliance rules and policy requirements into automated tests. To make it possible your devs need to translate human-readable rules received from non-tech people into code, and compliance-as-a-code tools should do the rest (point out where you are breaking the rules or block updates if they are not in line with your policies).
  10. Runtime application self-protection (RASP) allows applications to run continuous security checks and react to attacks in real-time by getting rid of the attacker (e.g. closing his session) and alerting your team about the attack. Similarly to IAST, it can hurt app performance. It’s 4th testing category that I show in the pipeline (after SAST, DAST, and IAST) and you should have at least two of them in your stack.
  11. Web Application Firewall (WAF) lets you define specific network rules for a web application and filter, monitor, and block HTTP traffic to and from a web service when it corresponds to known patterns of attacks like, e.g. SQL injection. All big cloud providers like Google, AWS and Microsoft have got their WAF, but there are also specialised companies like Cloudflare, Imperva and Wallarm, for example.
  12. Monitoring tools — as mentioned in my DevOps guide, monitoring is a crucial part of the DevOps manifesto. DevSecOps takes it to the next level and covers not only things like downtime, but also security threats.
  13. Chaos engineering. Tools from this category allow you to test your app under different scenarios and patch your holes before problems emerge. “Breaking things on purpose is preferable to be surprised when things break” as said by Mathias Lafeldt from Gremlin.
  14. Vulnerability management — these tools help you identify the holes in your security systems. They classify weaknesses by the potential impact of malicious attacks taking advantage of them so that you can focus on fixing the most dangerous ones. Some of the tools might come with addons automatically fixing found bugs. This category is full of open source solutions, and here you can find the top 20.

Reference Architectures of DevSecOps?

Refer: https://cdn2.hubspot.net/hubfs/4132678/Resources/DevSecOps%20Reference%20Architectures%20-%20March%202018.pdf

References:
https://medium.com/inside-inovo/devsecops-explained-venture-capital-perspective-cb5593c85b4e

    Wednesday, September 22, 2021

    What Tech Stacks need to be used?

    Question: What Tech Stacks need to be used?

    Answer: It depends!

    Detailed Answer: 

    It depends on various aspects of your functional and non-functional requirements. To know more, how this has been solved, then have a look at the following website stackshare to know what tech stacks are better for your specific requirements with a detailed decisions log from more than 1M developers community and with the information of tradeoffs and etc.

    https://stackshare.io/feed


    Friday, April 30, 2021

    9 Pillers of DevOps Best Practices


    Leadership Practices for DevOps

    • Leaders demonstrate a long-term vision for organizational direction and team direction.
    • Leaders intellectually stimulate the team by encouraging them to ask new questions and question basic assumptions about the work.
    • Leaders provide inspirational communication that inspires pride in being part of the team, says positive things about the team, inspires passion and motivation and encourages people to see that change brings opportunities.
    • Leaders demonstrate support by considering others’ personal feelings before acting, being thoughtful of others’ personal needs and caring about individuals’ interests.
    • Leaders promote personal recognition by commending teams for better-than-average work, acknowledging improvements in the quality of work and personally complimenting individuals’ outstanding work.

    Collaborative Culture Practices for DevOps

    • The culture encourages cross-functional collaboration and shared responsibilities and avoids silos between Dev, Ops and QA.
    • The culture encourages learning from failures and cooperation between departments.
    • Communication flows fluidly across the end-to-end cross-functional team using collaboration tools where appropriate (for example Slack, HipChat, Yammer).
    • The DevOps system is created by an expert team, and reviewed by a coalition of stakeholders including Dev, Ops and QA.
    • Changes to end-to-end DevOps workflows are led by an expert team, and reviewed by a coalition of stakeholders including Dev, Ops and QA.
    • DevOps system changes follow a phased process to ensure the changes do not disturb the current DevOps operation. Examples of implementation phases include: proof of concept (POC) phase in a test environment, limited production and deployment to all live environments.
    • Key performance indicators (KPIs) are set and monitored by the entire team to validate the performance of the end-to-end DevOps pipeline, always. KPIs include the time for a new change to be deployed, the frequency of deliveries and the number of times changes fail to pass the tests for any stage in the DevOps pipeline.

    Design-for-DevOps Practices for DevOps

    • Products are architected to support modular independent packaging, testing and releases. In other words, the product itself is partitioned into modules with minimal dependencies between modules. In this way, the modules can be built, tested and released without requiring the entire product to be built, tested and released all at once.
    • Applications are architected as modular, immutable microservices ready for deployment in cloud infrastructures in accordance with the tenets of 12-factor apps, rather than monolithic, mutable architectures.
    • Software source code changes are pre-checked with static analysis tools, prior to commit to the integration branch. Static analysis tools are used to ensure the modified source code does not introduce critical software faults such as memory leaks, uninitialized variables, and array-boundary problems.
    • Software code changes are pre-checked using peer code reviews prior to commit to the integration/trunk branch.
    • Software code changes are pre-checked with dynamic analysis tests prior to committing to the integration/trunk branch to ensure the software performance has not degraded.
    • Software changes are integrated in a private environment, together with the most recent integration branch version, and tested using functional testing prior to committing the software changes to the integration/trunk branch.
    • Software features are tagged with software switches (i.e., feature tags or toggles) during check-in to enable selective feature-level testing, promotion and reverts.
    • Automated test cases are checked in to the integration branch at the same time code changes are checked in, together with evidence that the tests passed in a pre-flight test environment.
    • Developers commit their code changes regularly, at least once per day.

    Continuous Integration Practices for DevOps

    • A software version management (SVM) system is used to manage all source code changes. (Git, Perforce, Mercurial, etc.)
    • A software version management (SVM) system is used to manage all versions of code images changes used by the build process. (Git, Perforce, Mercurial, etc.)
    • A software version management (SVM) system is used to manage all versions of tools and infrastructure configurations and tests that are used in the build process. (Git, Perforce, Mercurial, etc.)
    • All production software changes are maintained in a single trunk or integration branch of the code.
    • The software version(s) for supporting each customer release are maintained in a separate release branch to support software updated for each release.
    • Every software commit automatically triggers a build process for all components of the module that has code changed by the commit. The system is engineered such that resources are always sufficient to execute a build.
    • Once triggered, the software build process is fully automated and produces build artifacts, provided the build time checks are successful.
    • The automated build process checks include unit tests.
    • Resources for builds are available on-demand and never block a build.
    • CI builds are fast enough to complete incremental builds in less than an hour.
    • The build process and resources for builds scale up and down automatically according to the complexity of the change. If a full build is required, the CI system automatically scales horizontally to ensure the builds are completed as quickly as possible.

    Continuous Testing Practices for DevOps

    • Development changes are pre-flight tested in a clone of the production environment prior to being integrated to the trunk branch. (Note: “production environment” means “variations of customer configurations of a product.”)
    • New unit and functional regression tests that are necessary to test a software change are created together with the code and integrated into the trunk branch at the same time the code is. The new tests are then used to test the code after integration.
    • A test script standard is used to guide test script creation, to ensure the scripts are performing the intended test purpose and are maintainable.
    • Tests are selected automatically according to the specific software changes. CT is orchestrated dynamically, whereby the execution of portions of the CT test suites may be accelerated, or skipped entirely, depending on how complex or risky the software changes are.
    • Test resources are scaled automatically according to the resource requirements of specific tests selected and the available time for testing.
    • Release regression tests are automated. At least 85% of the tests are fully automated and the remaining are auto-assisted if portions must be performed manually.
    • Release performance tests are automated to verify that no unacceptable degradations are released.
    • Blue/green testing methods are used to verify deployments in a staging environment before activating the environment to live. A/B testing methods are used together with feature toggles to try different versions of code with customers in separate live environments. Canary testing methods are used to try new code versions on selected live environments.
    • The entire testing life cycle, which may include pre-flight, integration, regression, performance and release acceptance tests are automatically orchestrated across the DevOps pipeline. The test suites for each phase include a predefined set of tests that may be selected automatically according to predefined criteria.

    Elastic Infrastructure Practices for DevOps

    • The data and executable files needed for building and testing builds are automatically archived frequently and can be reinstated on demand. Archives include all release and integration repositories. If an older version of a build needs to be updated, then the environment for building and testing that version can be retrieved and reinstated on demand and can be accomplished in a short time (for example, minutes to hours.)
    • Build and test processes are flexible enough to automatically handle a wide variety of exceptions gracefully. If the build or test process for a component is unable to complete, then the process for that failed component is reported and automatically scheduled for analysis, but build and test processes for other components continue. The reasons for the component failure are automatically analyzed and rescheduled if the reason for the failure can be corrected by the system; if not, then it is reported and suspended.
    • System configuration management and system inventory is stored and maintained in a configuration management database (CMDB).
    • Infrastructure changes are managed and automated using configuration management tools that assure idempotency.
    • Automated tools are used to support immutable infrastructure deployments.
    • Equal performance for all. The user performance experience of the build and test processes by different teams are consistent for all users, independent of location or other factors. There are SLAs and monitoring tools that ensure the user performance experience is consistent for all users.
    • Fault recovery mechanisms are provided. Build and test system fault monitoring, fault detection, system and data monitoring and recovery mechanisms exist. They are automated and are consistently verified through simulated failure conditions.
    • Infrastructure failure modes are frequently tested.
    • Disaster recovery procedures are automated.

    Continuous Monitoring Practices for DevOps

    • Logging and proactive alert systems make it easy to detect and correct DevOps system failures. Logs and proactive system alerts are in place for most DevOps component failures, and are organized in a manner to quickly identify the highest-priority problems.
    • Snapshot and trend results of each metric from each DevOps pipeline stage (for example, builds, artifacts, tests) are automatically calculated in process and visible to everyone in the Dev, QA and Ops Teams.
    • Key performance indicators (KPIs) for the DevOps infrastructure components are automatically gathered, calculated and made visible to anyone on the team that subscribes to them. Example metrics are availability (uptime) of computing resources for CI, CT and CD processes, time to complete builds, time to complete tests, number of commits that fail and number of changes that need to be reverted due to serious failures.
    • Metrics and thresholds for DevOps infrastructure components are automatically gathered, calculated and made visible to anyone on the team that subscribes to them. Example metrics are availability (uptime) of computing resources for CI, CT and CD processes, time to complete builds, time to complete tests, number of commits that fail and number of changes that need to be reverted due to serious failures.
    • Process analytics are used to monitor and improve the integration, test and release process. Descriptive build and test analytics drive process improvements.
    • Predictive analytics are used to dynamically adjust DevOps pipeline configurations. For analysis of test results, data may indicate a need to concentrate more testing in areas that have a higher failure trend.

    Continuous Security Practices for DevOps

    • Developers are empowered and trained to take personal responsibility for security.
    • Security assurance automation and security monitoring practices are embraced by the organization.
    • All information security platforms that are in use expose full functionality via APIs for automation capability.
    • Proven version control practices and tools are used for all application software, scripts, templates and blueprints that are used in DevOps environments.
    • Immutable infrastructure mindsets are adopted to ensure production systems are locked down.
    • Security controls are automated so as not to impede DevOps agility.
    • Security tools are integrated into the CI/CD pipeline.
    • Source code for key intellectual property on build or test machines are only accessible by trusted users with verified credentials. Build and test scripts do not contain credentials for access to any system that has intellectual property. Intellectual Property is divided such that not all of it exists on the same archive and each archive has different credentials.

    Continuous Delivery Practices for DevOps

    • Delivery and deployment stages are separate. The delivery stage precedes the deployment pipeline.
    • All deliverables that pass the delivery metrics are packaged and prepared for deployment using containers.
    • Deliverable packages include sufficient configuration and test data to validate each deployment. Configuration management tools are used to manage configuration information.
    • Deliverables from the delivery pipeline are automatically pushed to the deployment pipeline, once acceptable delivery measures are achieved.
    • Deployment decisions are determined according to predetermined metrics. The entire deployment process may take hours, but usually less than a day.
    • Deployments to production environments are staged such that failed deployments can be detected early and impact to customers isolated quickly.
    • Deployments are arranged with automated recovery and self-healing capabilities in case a deployment fails.

    What This Means

    DevOps is a powerful tool that enables many benefits for organizations that use it. Achieving performance efficiently with DevOps depends on following best practices. By following the nine pillars of practices enumerated in this blog, organizations can achieve the performance potential that DevOps has to offer.


    Refer: https://devops.com/nine-pillars-of-devops-best-practices/

    Sunday, March 14, 2021

    Kubernetes 101

     Kubernetes is gaining wide adoption. Even though a lot of us had an opportunity to work with this container orchestrator before, there is still a many of us, who have never played with this platform.

    Currently, there is a plenty of various courses/playgrounds, which can help you start working with the Kubernetes, like official Kubernetes tutorials or katacoda. I also went through them, but in this article, you will find not only theory but also examples, which help you implement your Kubernetes resources. We will deploy a complete application stack, consisting of a database and backend, frontend parts. In the end, you will find some exercises to do. I hope you will like it 🙂.

    👉 You can look at my Kubernetes troubleshooting guide, which covers the most common beginner questions and mistakes.

    For the sake of simplicity, in this article, I will use the short name for Kubernetes: k8s.

    #k8s #k8s cluster #k8s objects #deploy with kubectl #scaling & rollback #exercises

    Prerequisites

    Before we start, we need to install some tools and make sure that our environment is ready to play with Kubernetes.

    All the required tools, which have to be installed are listed in my Github repository, under the Prerequisites section. Prepare your environment, on the other hand, contains all commands, which have to be executed, before we start deploying our applications on Kubernetes.

    Kubernetes and its components

    #Kubernetes #Master #Nodes #kubelet #node processes

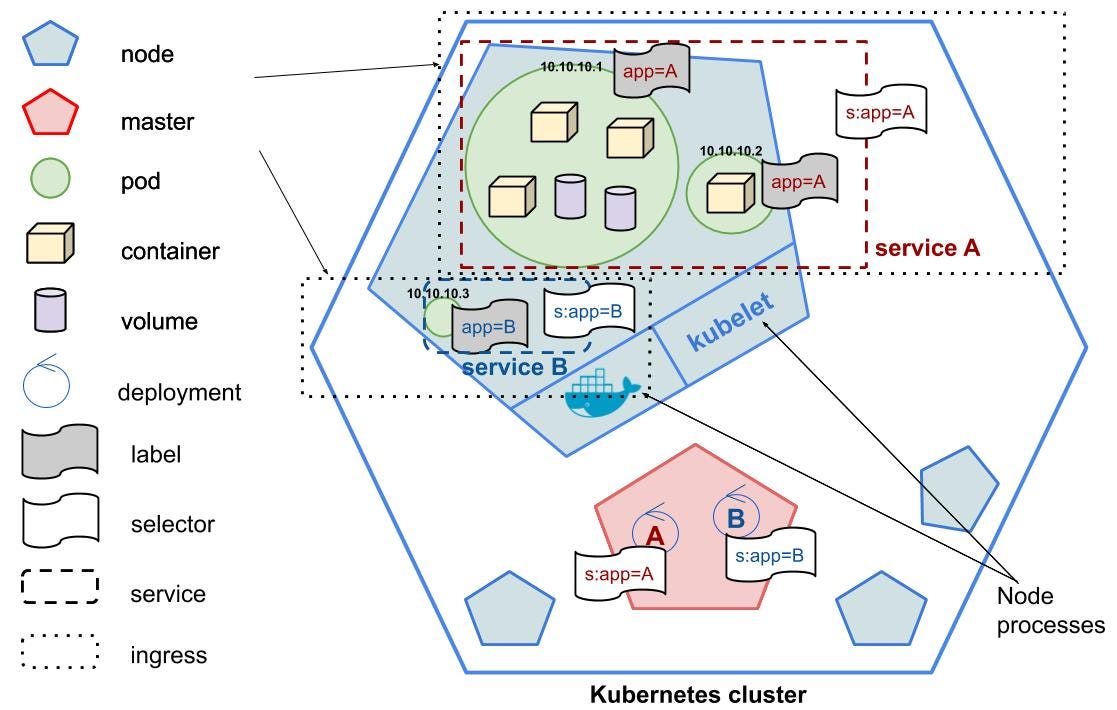
    Kubernetes is an open-source platform, very often called containers’ orchestrator. Each k8s cluster consists of multiple components, where Master, Nodes and k8s resources (k8s objects) are the most essential ones.

    Kubernetes cluster

    Master is the cluster orchestrator, which exposes the k8s API (docs). Every time, when we are deploying the app containers, we are telling something like: “Hey Master! Here is the docker image URL of my application. Please, start the app container for me.”. And then Master schedules the app instances (containers) to run on the Nodes. Kubernetes will choose where to deploy the app based on Nodes’ available resources.

    Master manages the cluster. It scales and schedules app containers and rolls out the updates.

    Nodes are k8s workers, which run app containers. A Node consists of the following processes:

    • kubelet — it’s an agent for managing the Node. It communicates with the Master using k8s API. It manages the containers and ensures that they are running and are healthy.
    • other tools — Node contains additional tools like Docker, to handle the container operations like pulling the image, running and so on.

    Nodes are workers, which run application containers. They consist of the kubelet agent, which manages the Node and comunicates with the Master.

    Kubernetes resources

    Pod

    Pod in Kubernetes cluster

    Pod is the smallest resource in k8s. It represents a group of one or more application containers and some shared resources (volumes). It runs on a private, isolated network, so containers can talk to each other using localhost. Normally, you would have one container per Pod. But sometimes, we can run multiple containers in one Pod. Typically it happens, when we want to implement side-car (read more about this pattern in Designing Distributed Systems or Dave’s post).

    Example:

    Pod example with the most common properties

    To deploy a single Pod, you should run kubectl create pod-file.yaml or kubectl apply -f pod-file.yaml. Both commands are quite similar, but in comparison to create (which creates a resource), apply modifies an existing k8s object or creates new if it doesn’t already exist. To see how it works, let’s clone this repository and run the following command:

    # deploy single Podkubectl apply -f example-pod.yaml# see running Podkubectl get pods

    💡 Kubectl is a command-line client for k8s. It communicates with kube-apiserver (REST server), which then performs all operations.

    💡 Most of the k8s commands consist of an action and a resource, on which this action is performed:

    # <action> represents a verb like create, delete. 
    # <resource> represents a k8s object.
    kubectl <action> <resource> <resource-name> <flags># e.g.
    kubectl get pods my-pod
    kubectl get pods
    kubectl create deployment.yaml
    kubectl apply -f deployment.yaml

    👉 Other commands: cheatsheet and kubectl overview.

    💡 You can use short names for the k8s resources:

    pods (or pod): po, 
    services (or service): svc,
    deployments (or deployment): deploy,
    ingresses (or ingress): ing,
    namespaces (or namespace): ns,
    nodes (or node): no
    # example (means kubectl get pods (or kubectl get pod))kubectl get po

    Pod is the smallest resource in k8s. It runs on a private, isolated network and hosts app container instance. One Pod can contain multiple containers.

    Deployment

    Deployment in Kubernetes cluster

    Deployment is a k8s abstraction, which is responsible for managing (creating, updating, deleting) Pods. To deploy your application, you can always use Pods as in the previous example, however, using Deployments is a recommended way, which brings a lot of advantages:

    • you don’t have to worry about managing Pods. If one of the Pods terminates, the Deployment controller will create another Pod immediately. Deployments always take care of having a proper number of running Pods,
    • you have only one file, where you “define” Pod specification and desired number of running Pods. Pod specification is under spec.template key, whereas number or running Pods is under spec.replicas,
    • it provides a self-healing mechanism in case of machine failure. If the Node hosting an instance goes down or is deleted, the Deployment controller replaces the instance with an instance on another Node in the cluster,
    • it provides an easy way to rolling updates, etc. If you want to apply a change to your Pods, Deployment will update all Pods gradually, one by one.

    Example:

    Deployment example with the most common properties

    Let’s create Deployments!

    Before we start deploying backend and frontend, we have to make sure that the database is up and running. Our web server depends on the database’s health, so in case of issues with database connection, it will throw an error. Clone the Github repository and run the following commands to deploy the database:

    # deploy databasekubectl apply -f database/deployment/database-deployment.yaml
    kubectl apply -f database/deployment/database-service.yaml

    Now, let’s build the image and deploy backend:

    # build backend docker imagedocker build -t backend:v1 ./backend# deploy backendkubectl apply -f ./backend/deployment/backend-deployment.yaml

    Repeat the above steps to deploy the frontend. The source code with the Dockerfile is under thefrontend/ directory:

    # build frontend docker imagedocker build -t frontend:v1 ./frontend# deploy frontendkubectl apply -f ./frontend/deployment/frontend-deployment.yaml

    As a result, you should see running Deployments and Pods inside the cluster:

    kubectl get po,deploy
    Screenshot from iTerm — kubectl get po, deploy

    Deployment is responsible for creating and updating instances of your application. It monitors the application instance and provides a self-healing mechanism in case of machine failure.

    Service

    Service in Kubernetes cluster

    We already have Deployments, which started Pods with Docker containers inside. Even though they are deployed and ready to use, we can’t access them. Now it’s time to introduce a Service resource!

    Service is another k8s object. Using it, we can make our Pods accessible from the inside, or outside k8s cluster. Service matches a set of Pods using selector defined in the Service under spec section and labels defined in the Pods’ metadata. So if the Pod has the label e.g.app: my-app, then the Service uses this label as a selector to know, which Pods should it expose.

    Currently, Service has only 4 types:

    • ClusterIP — the default one. It allocates a cluster-internal IP address, and it makes our Pods reachable only from the inside the cluster.
    • NodePort — built on top of the ClusterIP (ClusterIP on steroids 💪). Service is now reachable not only from the inside of the cluster through the service’s internal cluster IP, but also from the outside: curl <node-ip>:<node-port>. Each Node opens the same port (node-port), and redirects the traffic received on that port to the specified Service.
    • LoadBalancer — build on top of the NodePort (NodePort on steroids 💪). Service is accessible outside the cluster: curl <service-EXTERNAL-IP>. Traffic is now coming via LoadBalancer, which then is redirected to the Nodes on a specific port (node-port).
    • ExternalName — this type is different than the previously mentioned. Here, you can have access to an external reference (web services/database/…) deployed somewhere else. Your Pods running in the k8s cluster can access them by using name specified in the Service YAML file. If you are more interested in ExternalName type, go to 👉 Kubernetes troubleshooting.

    Example:

    Service example with the most common properties

    Let’s create Services!

    👉 Links to the Github repository and Kubernetes troubleshooting article.

    # deploy backend Servicekubectl apply -f ./backend/deployment/backend-service.yaml# deploy frontend Servicekubectl apply -f ./frontend/deployment/frontend-service.yaml

    As a result, you should see running Services inside the cluster:

    kubectl get svc
    Screenshot from iTerm — kubectl get svc

    Service defines the policy, by which we are able to access the Pods. Service matches a set of Pods using his selector and Pod’s labels. There are 4 types of Services: ClusterIP, NodePort, LoadBalander and ExternalName. Connections to the Service are load-balanced across all the backing pods.

    Ingress

    Ingress in Kubernetes cluster

    Ingress is a simple proxy, which routes traffic to the Services in the cluster. In one Ingress you can specify multiple Services to which it will redirect the traffic. Potentially, we don’t have to use Ingresses, but using it brings some advantages like having virtual hosts, SSL, CORS settings and so on.

    Example:

    Simple Ingress template with the most common properties

    Let’s create Ingresses!

    👉 Links to the Github repository and Kubernetes troubleshooting article.

    # deploy backend Ingresskubectl apply -f ./backend/deployment/backend-ingress.yaml# deploy frontend Ingresskubectl apply -f ./frontend/deployment/frontend-ingress.yaml

    As a result, you should see running Ingresses inside the cluster:

    kubectl get ing
    Screenshot from iTerm — kubectl get ing

    We have already deployed a complete application stack. Now, let’s check how does it look in the browser.

    Ingress is a simple proxy, which routes the traffic to the Services in the cluster. It is easily extensible to take care of eg. CORS settings or SSL. It’s possible to have one Ingress for all Services in your cluster.

    Scaling, rollback and quick updates

    Scaling

    There are a couple of ways to quickly scale up or down replicas of the Deployment. You can scale them based on specific conditions, like current replicas number. If you need, you can also turn on autoscaling in the cluster. Read this resource for more details.

    # scale the resource to specific number of replicaskubectl scale --replicas=REPLICAS_NUMBER -f your-yaml-file.yaml# example: scale backend-deployment.yamlkubectl scale --replicas=3 ./backend/deployment/backend-deployment.yaml# scale up to 3, when the current number of replicas of deployment is 2kubectl scale --current-replicas=2 --replicas=3 deployment/DEPLOYMENT_NAME# autoscale deployment between 2 - 10kubectl autoscale deployment DEPLOYMENT_NAME --min=2 --max=10

    👉 More scaling commands: cheatsheet.

    Rollback

    Sometimes it happens that we deployed a new feature, which has a bug. If it’s something serious, engineers choose the option to roll back the current version to the previous one. Kubernetes allows us to do it

    # rolling update "c" containers of "DEPLOYMENT_NAME" deployment, updating the IMAGE_NAME imagekubectl set image deployment/DEPLOYMENT_NAME c=IMAGE_NAME:v2# rollback to the previous deployment  

    kubectl rollout undo deployment/DEPLOYMENT_NAME
    # watch rolling update status of deployment until completion

    kubectl rollout status -w deployment/DEPLOYMENT_NAME

    Quick updates

    # update a single-container pod's image version (tag) to v4kubectl get pod POD_NAME -o yaml | sed 's/\(image: IMAGE_NAME\):.*$/\1:v4/' | kubectl replace -f -# add a labelkubectl label pods POD_NAME new-label=awesome# add an annotationkubectl annotate pods POD_NAME icon-url=http://goo.gl/XXBTWq

    Exercise

    Now it’s time for an exercise for you. Inside the /exercise directory, you will find a small service with Dockerfile. All you need to do is build the image and create YAMLs to deploy the app on k8s!

    Good luck! 🚀

    Conclusion

    The tutorial, which you have just finished allows you to start working with Kubernetes. I tried to point out the most important/tricky parts, which sometimes gave me sleepless nights 😴.

    Kubernetes is a very powerful platform. When you understand the basic concepts, you can already do a lot, but you will be still hungry to learn and play more with it. Until now, I will leave you with some resources, which I encourage you to read one by one.

    Refer: Original post at https://medium.com/swlh/kubernetes-in-a-nutshell-tutorial-for-beginners-caa442dfd6c0